How to Create Custom Reports in Rodeo Ticket
Custom Reports Creation Step-by-Step Guide Contents
- Custom Reports Creation Step-by-Step Guide
- 1. Select type of graph or report.
- 2. Choose what you’d like the graph or report to show.
- 3. Adjust filters in the preview.
- 4. Name and save your graph or report.
- 5. Your new report or graph will now appear in your report list.
- 18 Standard Reports Pre-built for You
- 1. Revenue by Type
- 2. Ticket Heat Map
- 3. Ticket Retention
- 4. Revenue by Event Day
- 5. Revenue per Section
- 6. Revenue per Event Time
- 7. Tickets Sold per Section
- 8. Revenue per Section & Event Time
- 9. Tickets by Section & Event
- 10. Rodeo Year Revenue Trends
- 11. Revenue by Ticket Type
- 12. Rodeo Year Ticket Trends
- 13. Yearly Totals by Ticket Type
- 14. Yearly Totals by Event Day
- 15. Median Order Stats
- 16. Question Stats
- 17. Financial Reports
- 18. Direct Deposit Reports
Reports help you interpret data, which helps you make better decisions for your rodeo:
- Better marketing decisions.
- Better crowd management decisions.
- Better financial decisions.
You need reliable reports. Software systems often come with pre-built reports, which are convenient. However, you may still need reports beyond what is already available. In Rodeo Ticket’s software, you benefit from pre-built reports and the ability to create custom reports.
Custom Reports Creation Step-by-Step Guide
Within Rodeo Ticket’s software, you can create custom line graphs, doughnut charts, tables, and more. Here’s how:
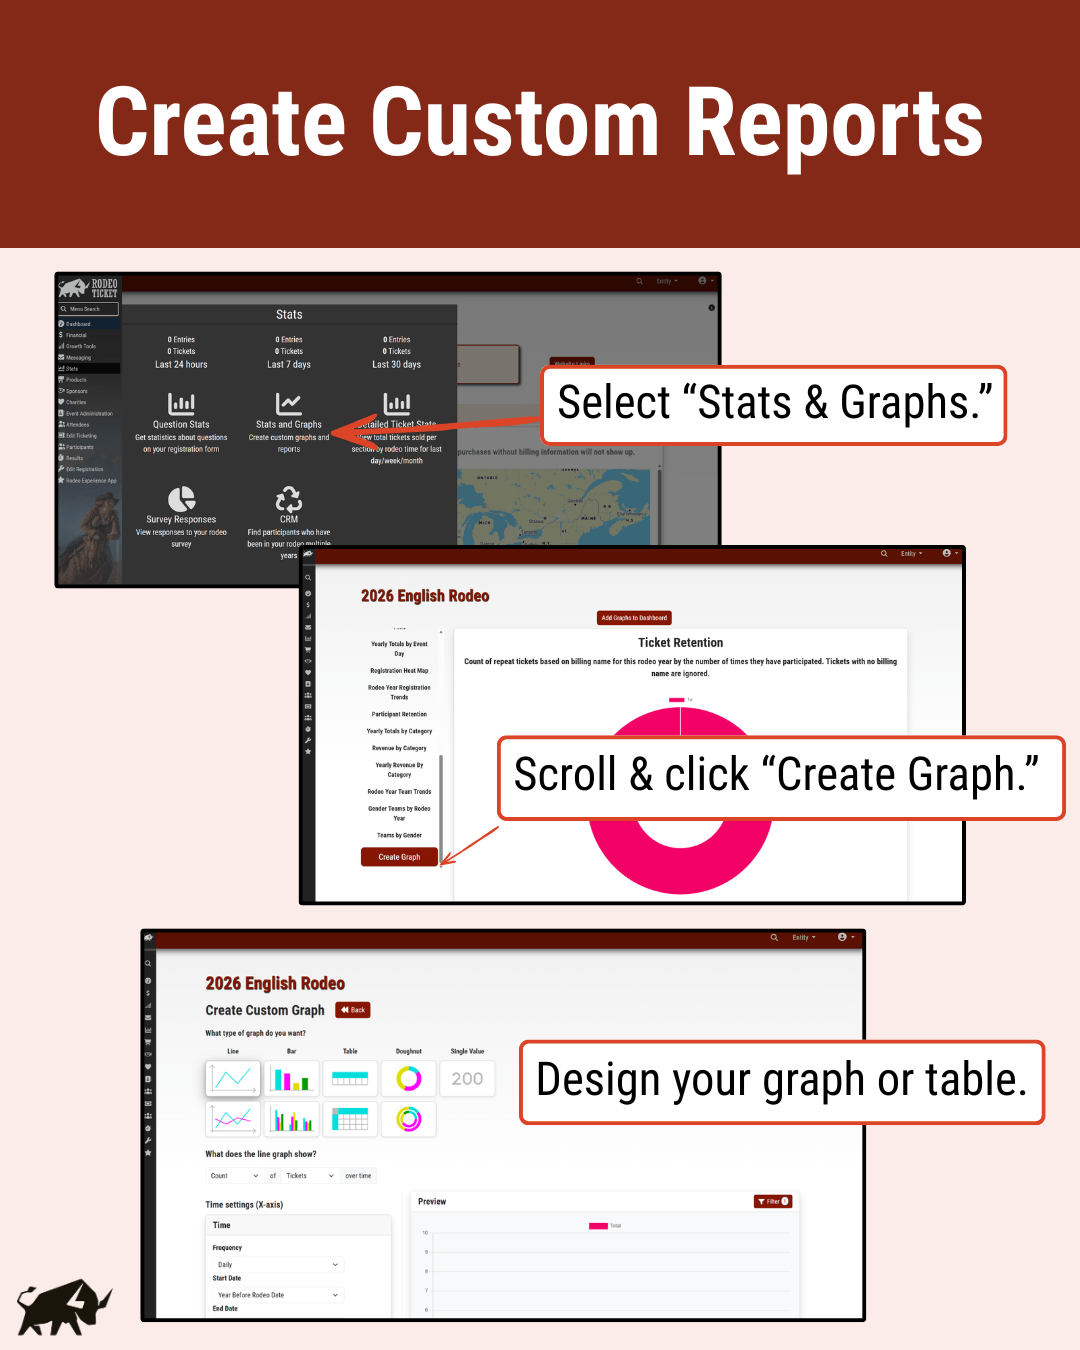
1. Select type of graph or report.
You can choose from a line graph, bar graph, table, doughnut chart, or a single value.
Think about the information you need. Next, consider what visual is the best or easiest way to understand that information.
For example, if you’d like to see the total number of comp tickets, opting for a single value is best. If you want to look at how merchandise sales have changed over time, choose a line graph.
2. Choose what you’d like the graph or report to show.
Once you’ve selected the type of graph you’d like, fill in the rest of the details necessary to complete your graph.
For a line graph, you’ll need to specify what you’d like to see over a specified time period. For a single value, you just need to select the value you’d like to display.
3. Adjust filters in the preview.
Once you’ve made these first settings, double check your filters.
Your data is automatically filtered to show Active orders (completed transactions). If you’re trying to understand your Incomplete orders, you’ll need to de-select “Active” and select “Incomplete”.
You can also add more filters to get information about specific kinds of orders. For example, you can filter by payment type, price range, event day, event type, etc.
4. Name and save your graph or report.
Once you’re happy with your filters, name your report and click “Save”.
5. Your new report or graph will now appear in your report list.
Now your graph will appear on the “Stats and Graphs” page, so you can see it quickly. You can even add your new report to your dashboard so you can see the details as soon as you open your rodeo.
18 Standard Reports Pre-built for You
You don’t need to custom build every report you need. Rodeo Ticket already produces 18 standard reports for you. Most of these reports are found on the “Stats & Graphs” page under “Stats” in the sidebar menu. If a report is found somewhere else, its location is noted in its section below.
1. Revenue by Type
Review your cumulative revenue by source over time. Your total revenue is calculated after discounts and refunds.
With this report, you can measure how much revenue you’re generating from:
- ticket sales
- registration
- merchandise & concessions
- sponsor deals
- fundraising
With this information, you can identify your key revenue sources and where you could make a bigger emphasis to diversify your revenue streams.

2. Ticket Heat Map
With your ticket sales heat map, you can see all of the ticket purchases in the United States and Canada by zip code.
Use this information to place radio advertisements, billboards, newspaper ads, etc. Placing ads where people are already buying tickets helps you grow your audience and get the most out of traditional advertising methods.
3. Ticket Retention
Understand how many people are making your rodeo a tradition by looking at the count of repeat ticket orders based on billing name year over year.
It’s much easier and cheaper to keep your fans returning year after year compared to creating new fans. Of course, you have to do both. Emphasizing retention helps you secure future ticket revenue and gives you more wiggle room in your budget – if needed, you can get away with spending a little less on marketing.

4. Revenue by Event Day
Look at your cumulative revenue by event day over time to understand which performances drew the biggest crowds and which performances need more marketing or an additional incentive to bring more people in.

5. Revenue per Section
Use this report to see which sections drive the most revenue for your rodeo. Prioritize the experience in these sections. You can even consider raising prices if the demand is high and tickets in specific sections sell out fast.
6. Revenue per Event Time
Use this report to understand which event times are the most valuable for your rodeo. Consider raising the prices for event times that sell out quickly or prioritize the experience at these prime performances.
You can also find ways to generate more revenue at the less popular event times. Maybe you can shift in your messaging around those performances to generate more interest. Maybe you can host a special night – family night, ladies night, etc. – or offer a perk like a concessions discount to get more people to your rodeo.
7. Tickets Sold per Section
In addition to tracking your overall revenue, you can track your ticket quantities sold grouped by section. With this overall view, you can see which sections sell the most tickets for your rodeo.
8. Revenue per Section & Event Time
Instead of looking at revenue by sections and event times separately, you can look at them together for deeper insights.

9. Tickets by Section & Event
In addition to tracking your revenue by section and event, you can also review ticket sales by event time and section. You can see your top sections and top performances in one report.
10. Rodeo Year Revenue Trends
Compare total rodeo revenue by day year over year to understand how this year’s sales compare to previous years. With this information, you can adjust tactics and identify differences across rodeo years.

11. Revenue by Ticket Type
Get a sense of which tickets drive the most revenue – while VIP tickets are more expensive, the volume of your GA tickets may drive more revenue because of volume. This report helps you understand what ticket types are most important for your rodeo and can help you measure effectiveness if you’re testing out a new ticket type.

12. Rodeo Year Ticket Trends
Track the number of tickets sold each day and compare them to previous years to understand your ticket sale performance.
If you notice you’re behind previous years, identify new marketing and sales campaigns to test.
If you notice you’re ahead, figure out what has helped boost your sales so you can repeat it in future years.

13. Yearly Totals by Ticket Type
Review tickets sold for each price label you’ve created. Compare tickets sold for each price label year over year. With this information you can see where the bulk of your ticket sales come from and track how changes to your ticketing structure affect fan choices year over year.
14. Yearly Totals by Event Day
See a quick report of yearly total ticket sales by event day to compare performance across years and identify your top-selling event days. Use this report to note any differences in top-selling days and identify which event days need better marketing or adjustments to get more people to that performance.
Alternatively, you can identify days to stop offering performances, especially if the low sales occur more than one year in a row.
15. Median Order Stats
On the “View Orders” page under “Financials”, you’ll see quick stats at the top of your page:
- Median Order Size
- Median Order Time
- Median Order Quantity
Rather than taking an average that a super large or super small order could skew, we show the median stats for your orders. The median is the middle order’s size, quantity, or time from all of your orders large to small or short to long.
16. Question Stats
If you ask questions as part of your ticket orders, you can see the overall data and drill down into details on the question responses on the “Question Stats” page under “Stats”.
You can see question answers by order and a summary of the total answers, which is helpful if you need deep detail on VIP requests or just need an overall summary of how people heard about your rodeo.

17. Financial Reports
You can also get various financial reports autogenerated through Rodeo Ticket’s system.
Under “Financials” on the “View Financials” page, you can see real-time financial reports of
- online revenue,
- cash revenue,
- check revenue,
- uploaded revenue, and
- combined revenue.
With these reports you can get a better understanding of your revenue and cash flow.
From this same page, you can also click to see “Chargeback Invoices”. On this page, you’ll see all of your chargebacks, which ones we won, and which ones we lost. You can also set up your chargeback prevention strategy on this page.
Under "Financials" on the "Forecasting" page, you can plan and track your spending alongside auto-tracked revenue. With this combined information on your rodeo costs and income, you can forecast and plan for a successful rodeo.
18. Direct Deposit Reports
Directors get direct deposit reports emailed to them each time funds are deposited into your rodeo’s account.
With all of these reports, you’ll have all of the information you need to understand what’s going on with your rodeo and make better decisions.